
Every number your restaurant makes, in one place.
From today’s sales by hour to last month’s food cost, DineBills reports are built from the same orders, shifts and stock movements your team records every day. Pick a branch and a date range, drill into the orders behind a total, and export it.
- 15 ready-made reports
- Any branch or all of them
- Excel export
- Daily summary email
- Ready-made reports across sales, staff, tax and stock
- 15
- Ready-made reports across sales, staff, tax and stock
- Date presets, from Today to Last month, plus custom
- 6
- Date presets, from Today to Last month, plus custom
- To an Excel workbook with the filters you applied
- 1 click
- To an Excel workbook with the filters you applied
- Numbers update as orders sync from every till
- Live
- Numbers update as orders sync from every till
Every report, and the question it answers.
These are the reports in the product today, by name. Pick a group to narrow the list.
- Sales
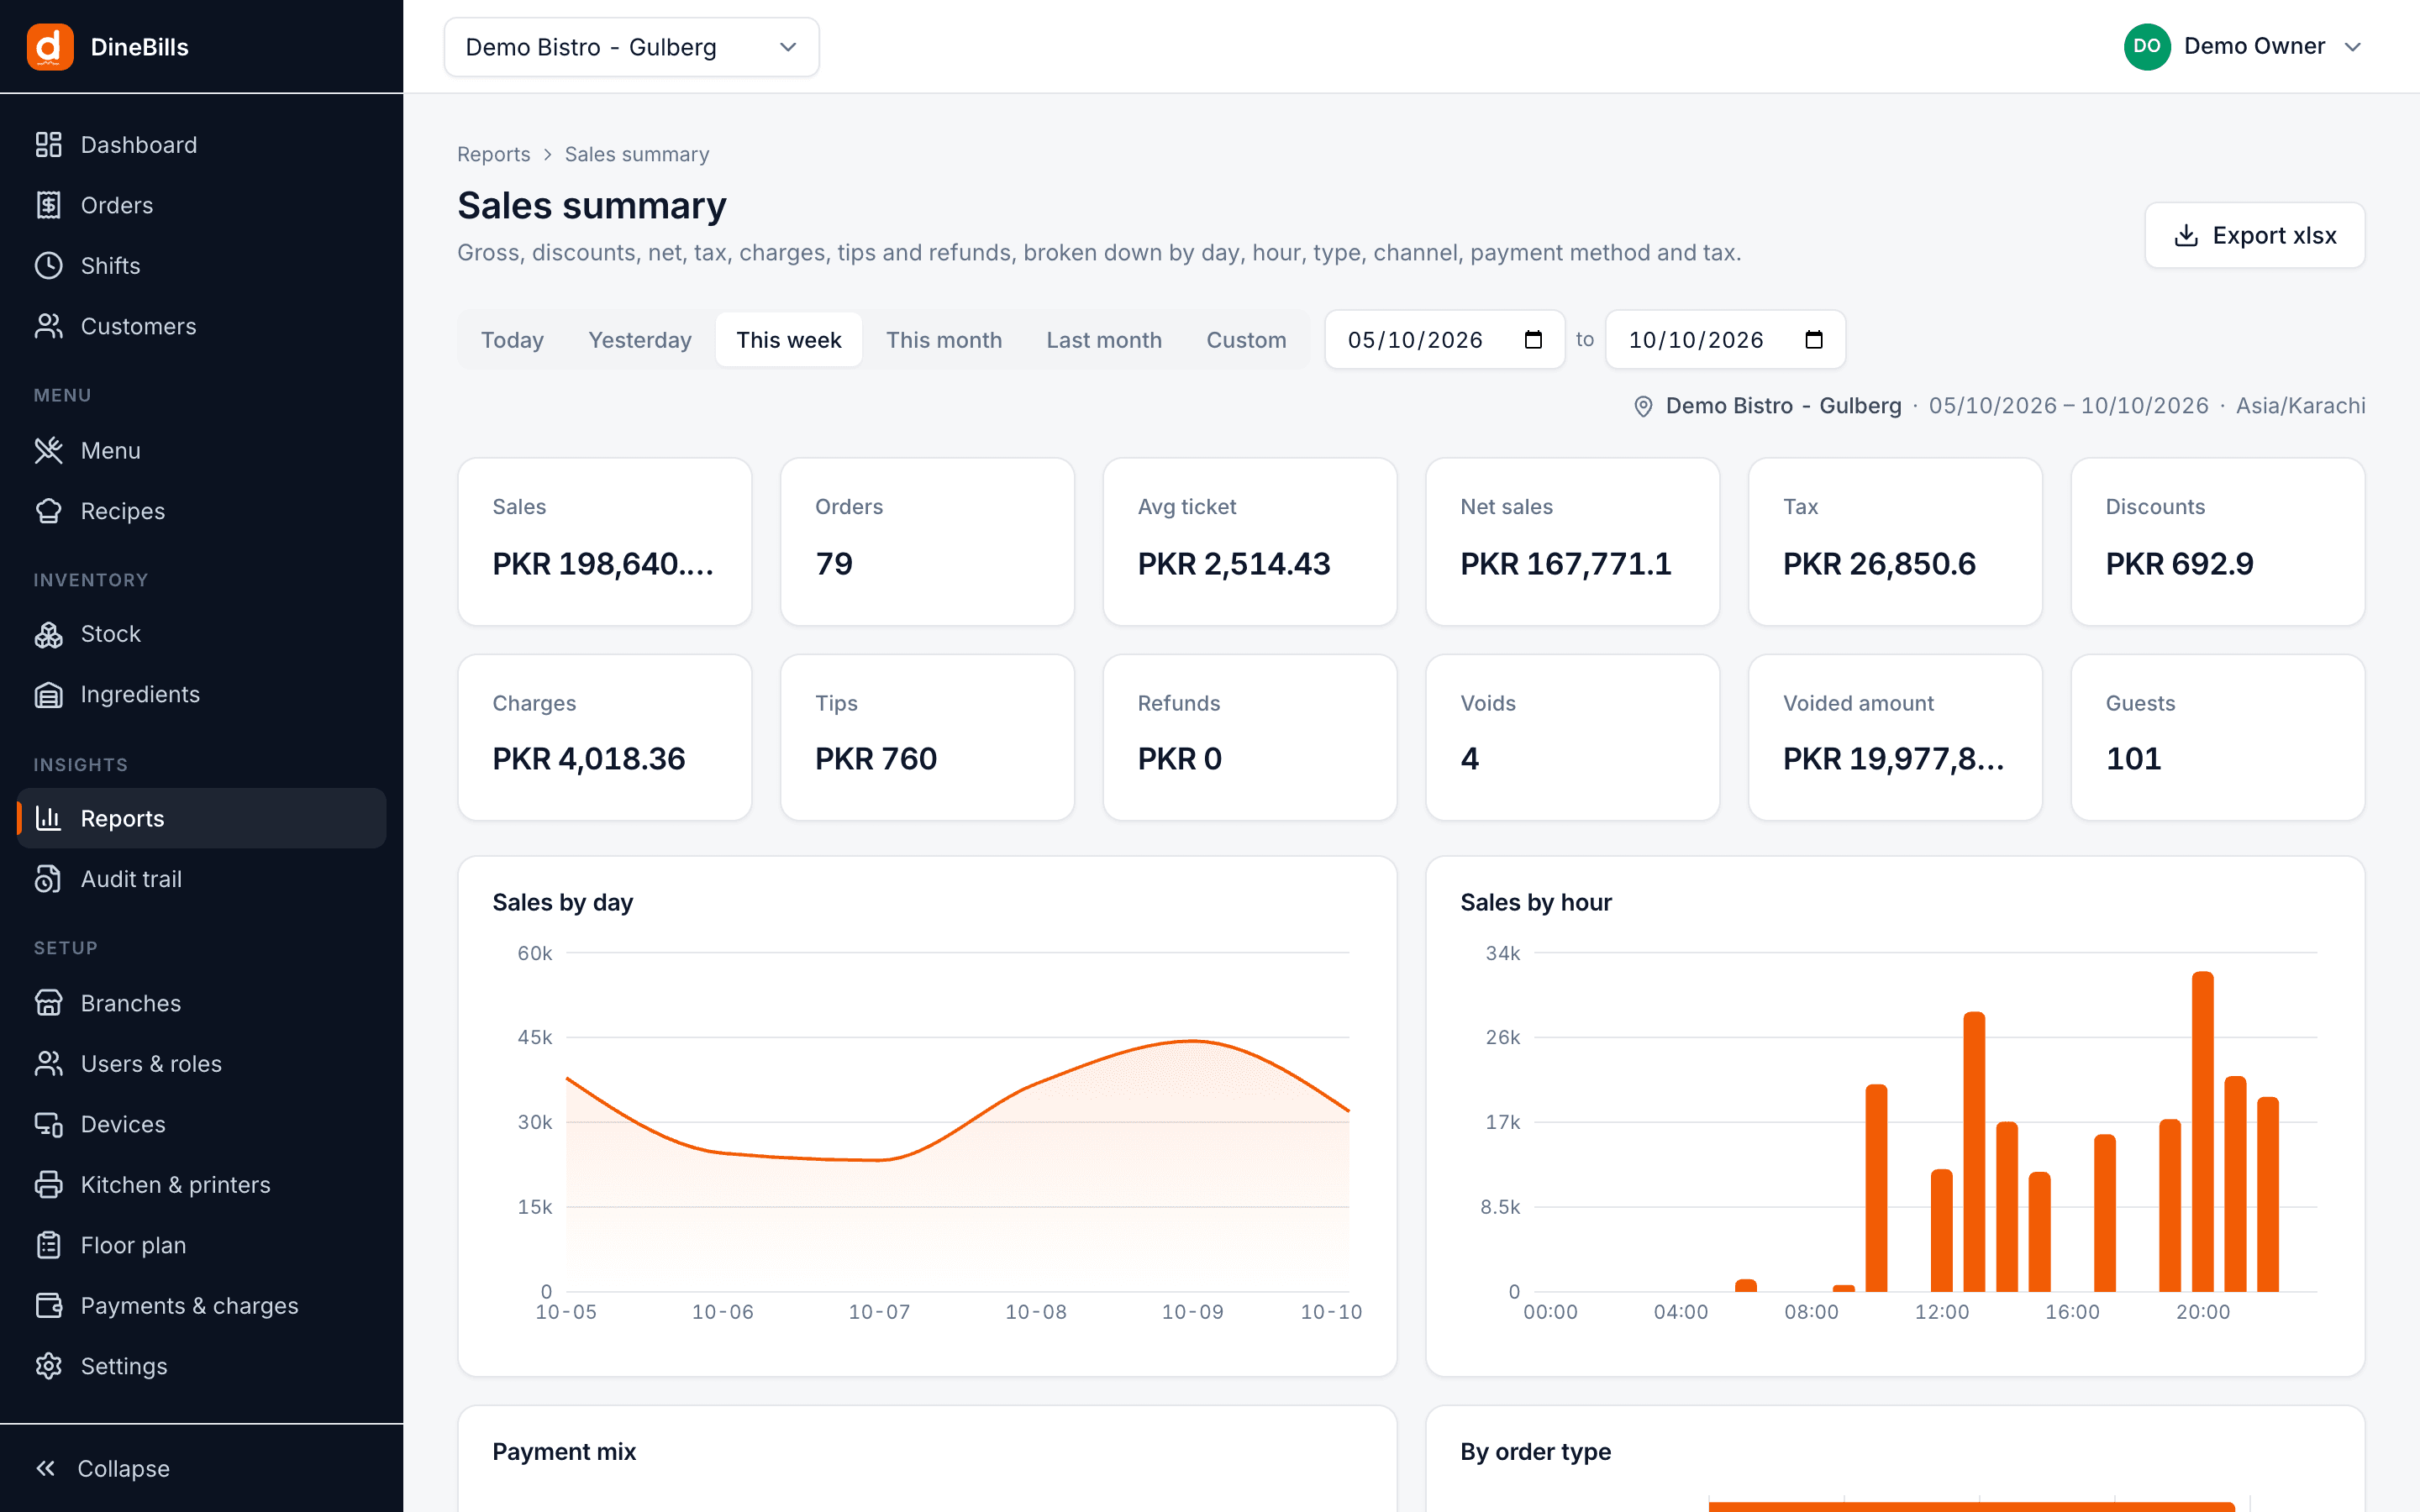
Sales summary
Gross, discounts, net, tax, charges, tips, refunds and guests for the range.
By day, hour, order type, channel, source, payment method and tax
- Sales
Orders
Every order in the range with its totals, opening to the full order detail.
Filter by status, order type, channel, source, staff, table and customer
- Sales
Discounts
Order and line discounts with the reason and who approved them.
By reason, user and day
- Sales
Voids & refunds
Voided orders, voided lines on live orders, and refunds, with reasons and users.
By reason, user and order
- Payments
Payments
Amounts collected by payment method and day, with tips and refunds.
By method and day
- Items & menu
Item mix
Quantity, gross, discounts, net and tax per item and variant, plus modifiers and deals.
By category, item, variant, modifier and deal
- Items & menu
Food cost
Recipe cost against selling price per item and variant, with margin and theoretical cost of what sold.
By category, item and variant
- Staff & shifts
Shifts
Cash drawer shifts with opening float, expected against counted cash and sales by tender.
By shift, terminal and user
- Staff & shifts
Staff sales
Orders, sales, average ticket, voids and discounts per user.
By user
- Inventory & consumption
Consumption
Theoretical usage from sales by recipe, against wastage and count variances.
By ingredient and location
- Inventory & consumption
Stock on hand
Current quantity and value of every ingredient in every location.
By ingredient and location
- Inventory & consumption
Stock movements
The full ledger: purchases, transfers, sales, wastage, counts and adjustments.
By movement type, ingredient and location
- Inventory & consumption
Wastage
Recorded wastage and what it cost.
By reason and by ingredient
- Inventory & consumption
Low stock
Ingredients at or below their threshold, with the shortfall to par.
By ingredient and location
- Tax
Taxes
Taxable amount and tax collected per tax rate and per day, ready for your return.
By tax rate and day
- Branch comparison
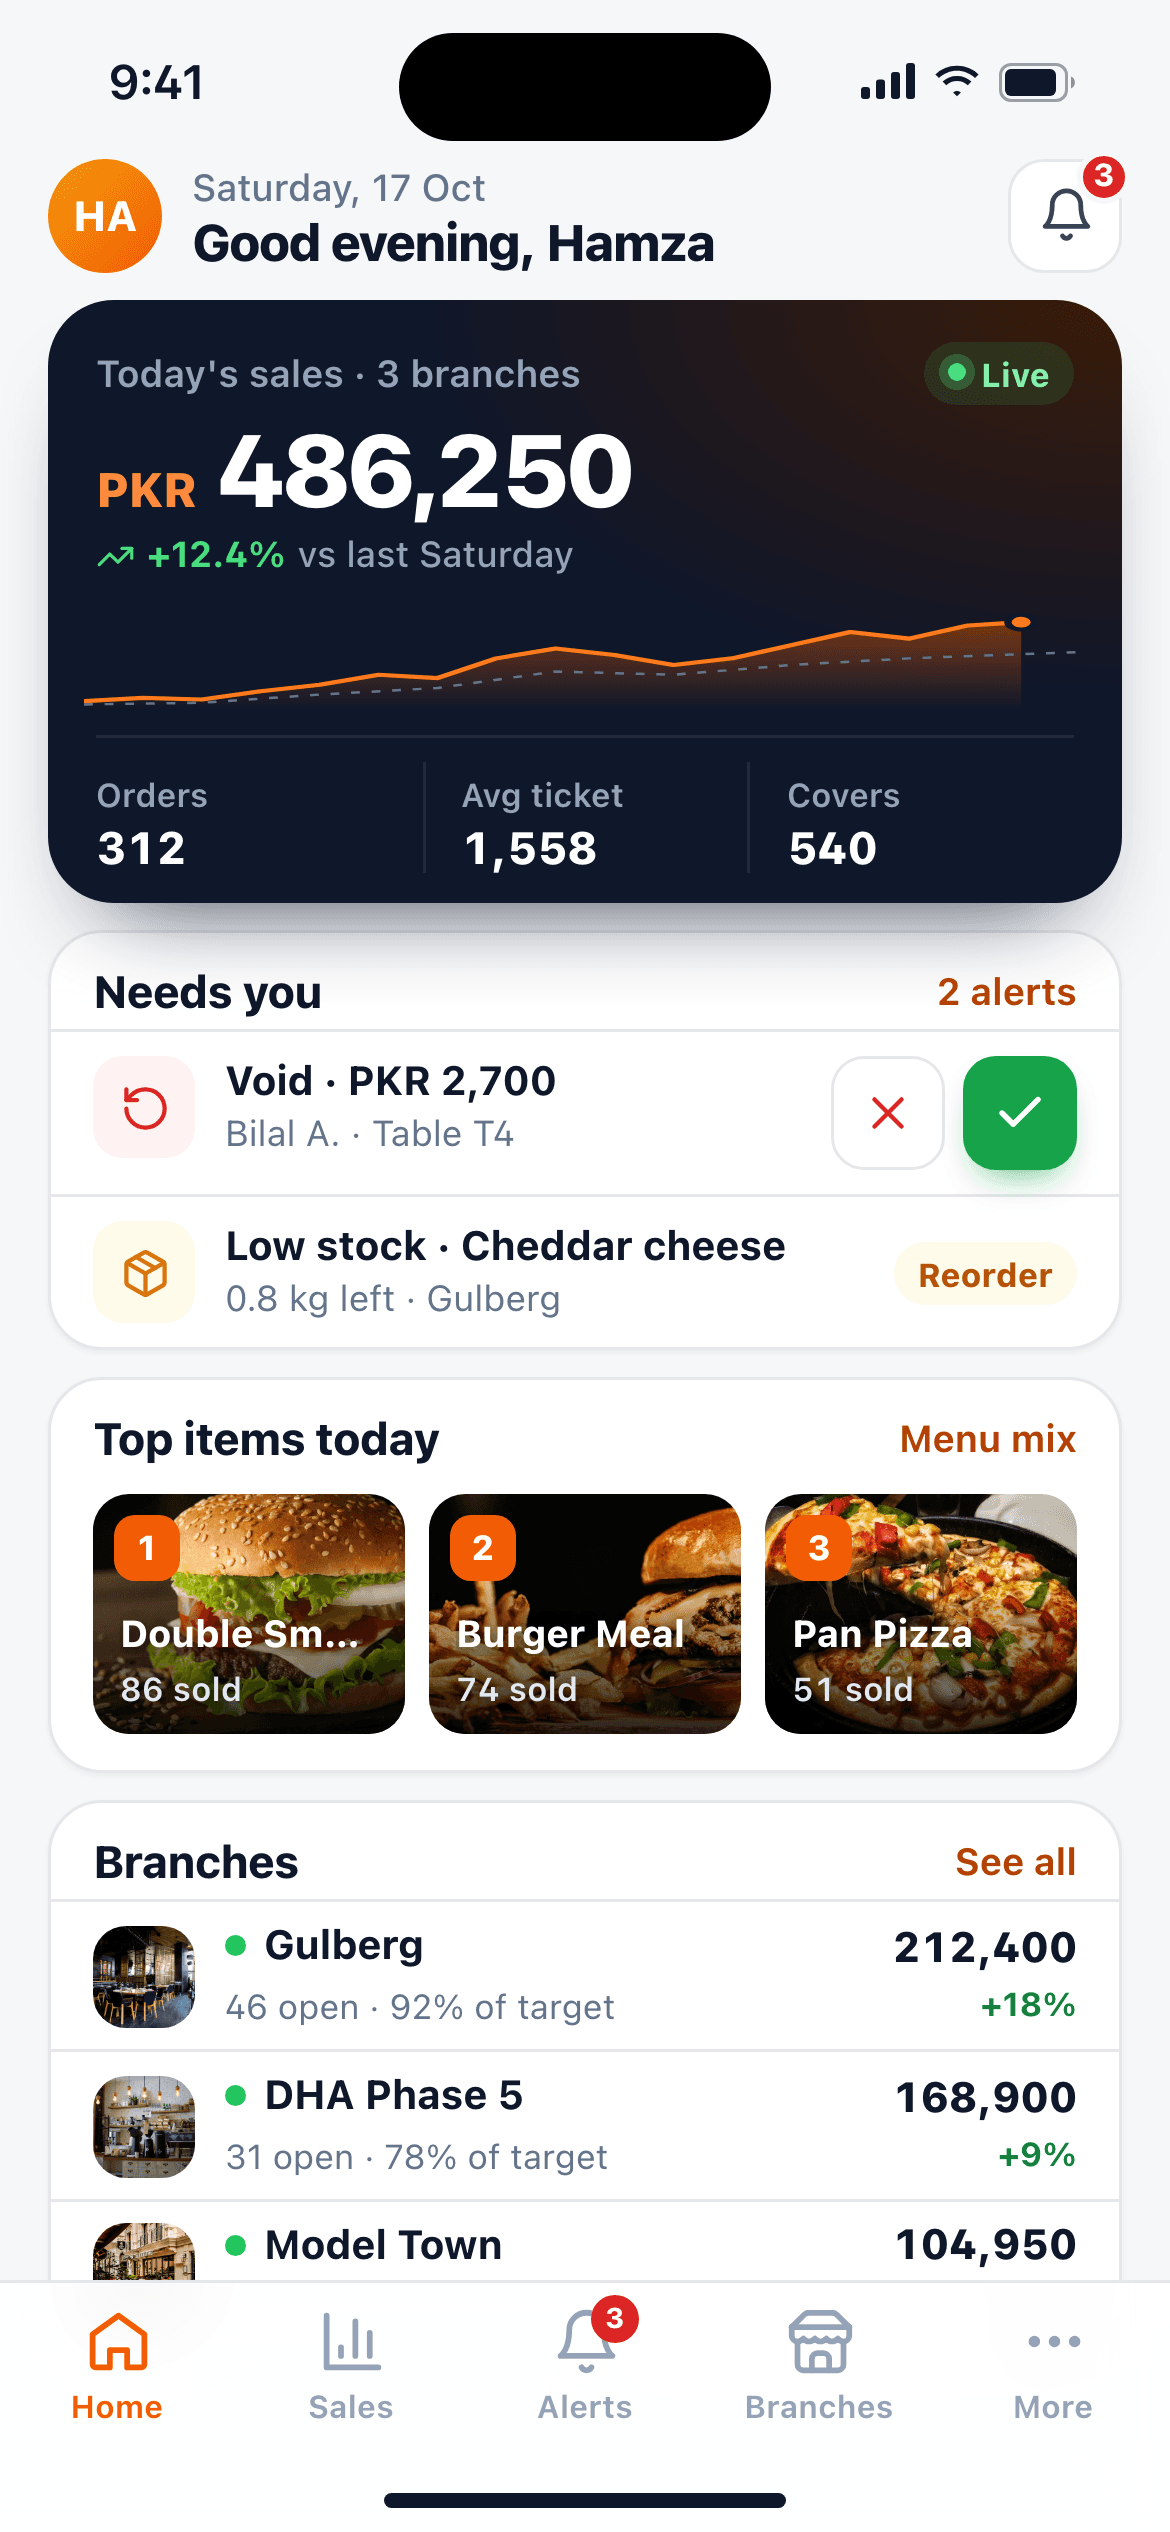
Live dashboard
Today’s sales, orders, average ticket, open orders, low stock and open shifts, with the last 14 days and sales by hour.
One branch or the whole company from the branch switcher
- Audit
Audit trail
Every void, discount, refund, price change, drawer open and setting change.
By user, action, device and branch
- Branch side-by-sideEvery branch in columns on the same measures.
- Kitchen prep timesTicket and prep times by station from the KDS.
- Delivery zone analysisOnline orders and sales by channel and zone.
- Period comparisonThis week against last week, this month against last year.
- Weekly and monthly emailsAny report on a schedule to any inbox.
- AI forecastsExpected sales per hour for prep and staffing.
Friday night, as it happens.
Every order, payment and shift reaches the cloud as it happens, so the numbers on your phone match the tills in the restaurant. Orders a till took while offline join the totals with their original time the moment they sync.
- Sales by hour, order type and payment method
- One branch or the whole company
- Open any total to see the orders behind it
Slice it the way you think about it.
Every report starts from a branch and a date range. Then each one breaks the numbers down the way that report needs: by hour for sales, by tender for payments, by location for stock.
Your accountant does not need a login.
Excel workbook
Any report to .xlsx with the branch and dates you chose, one sheet per section.
Print or PDF
A clean print view for the office file; save it as a PDF from the print dialog.
Drill down
Open the orders behind a total, then any order’s lines, payments and history.
Daily summary email
Yesterday’s sales, orders and refunds in the owner’s inbox every night.
Low-stock alert email
Ingredients below threshold, sent before service, not during it.
CSV lists
Users, customers and taxes exported to CSV for your other systems.
Sending sales to FBR, PRA or an accounting package? See integrations.
Frequently asked questions
Still curious? Talk to our team.
Can I see reports for all my branches together?
Yes. Every report and the dashboard follow the branch switcher, so you can run them for one branch or for the whole company.
Can I export reports for my accountant?
Yes. Every report exports to an Excel workbook with the same date range and branch you chose, and has a print view you can save as a PDF. Users, customers and taxes can also be exported to CSV.
Can reports be emailed to me?
Yes. The daily summary email sends the day’s numbers to the owner every night, and low-stock alerts arrive by email too. Weekly and monthly scheduled reports are rolling out.
What is the difference between an X and a Z report?
An X report is a mid-shift snapshot of sales and cash that does not close anything. A Z report closes the shift and records the final totals, expected cash, counted cash and variance. Both appear in the Shifts report.
Where does food cost come from?
From your recipes. Each item’s recipe cost is the sum of its ingredients at their average cost, adjusted for yield and wastage. The Food cost report sets that against the selling price and what actually sold.
Works together, out of the box.
Every DineBills product shares one menu, one set of orders and one back office. Nothing to connect, nothing to re-key.


Run your restaurant on numbers, not guesses.
Start a free trial and see your first sales, shift and stock reports the same day.
No credit card required · Setup help included · Cancel anytime